This is an excerpt from the book Crystal Reports .Net Programming.
Click to read
Examining the Crystal Report Designer
Each report within your application is just like any other component that your application uses. It is listed in the Solution Explorer window as a class in your project. When you double-click it, it opens the report in design mode and you can make changes to it.
Each report starts with five sections: Report Header, Page Header, Detail, Page Footer, and Report Footer. These sections are described in Table 1-1.
Table 1-1. Report sections.
| Section | Description |
|---|
| Report Header | Appears at the top of the first page of the report. |
| Page Header | Appears after the Report Header on the first page. On all the remaining pages it appears at the top of the page. |
| Group Header | Appears at the beginning of each new group. |
| Details | The row that displays the record information. There is usually one detail row for every record in the table. |
| Group Footer | Appears after all records of a group have been printed. |
| Page Footer | Appears at the bottom of each page. |
| Report Footer | Appears as the bottom of the page for the last page in the report. |
To the left of the report layout is the Toolbox as shown in Figure 1-7. When you have the report designer open, there are only a few controls available in the Toolbox. They are the Text Object, Line Object, and Box Object. These are the most basic of the controls available.
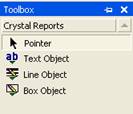
Figure 1-10. Crystal Report's toolbox.
Oddly enough, there are more controls that can be used on a report, but they aren't listed in the toolbox. You have to right-click on the report and select the Insert menu option. This menu is shown in Figure 1-8. There are ten controls on it that can be added to a report as well as a lot of special fields that display report specific information (e.g. page number, print date, etc.). These controls are described in Chapter 2.
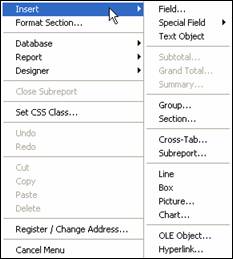
Figure 1-11. Crystal Report's Insert menu.
In the bottom right hand corner of the IDE is the Properties window. As expected, these properties are only applicable for the control that has the focus.
The CrystalReportViewer Control
The CrystalReportViewer control is used on a form to display a report. You have to use this control when you want to preview and print a report. It is found in the form's Toolbox as the last control listed. To access it, you have to use the down arrow to scroll down to it.
The CrystalReportViewer control is fully customizable. Since it is the only way to display a report in your application, you may need to customize it for some applications. You don't want a user to feel like they are looking at a third-party control when using your application. Each of the buttons can turned on or off in design mode or during runtime. You can also add your own buttons to a form and have them manipulate the report layout and respond to user events. This is described in Chapter 2.
Two-Pass Report Processing
Crystal Reports processes reports in two stages. This is called the Two-Pass Report Processing Model. The first pass creates the primary data to be printed. During the second pass this data is further processed to finalize it for printing.
The first pass is used to read individual records one at a time and calculate any formulas that use them. This pass will only calculate the formulas that are based on raw data within a record or that perform simple calculations. As each record is read and the formulas are calculated, the results are stored in a temporary file to be used during the second pass.
After the first pass is finished, Crystal Reports performs a second pass where it evaluates all summary functions on the data. This wasn't possible during the first pass because all the data had not been read yet. During the second pass all the raw data has been read into the temporary file and it can be evaluated and summarized as a whole.
Understanding the type of data that is processed during the Two-Pass Processing Model is essential to being able to write formulas and summarize data. Different chapters throughout this book reference this model for explaining when you can and can't use certain reporting functionality.
 Get the best selling Crystal Reports .NET book on the market!
Learn to build .NET 2003 reporting solutions with this expert guide.
Get the best selling Crystal Reports .NET book on the market!
Learn to build .NET 2003 reporting solutions with this expert guide.