Chapter 10 - Creating Cross-Tab Reports
Cross-tab reports are a powerful way to create summaries of data in a spreadsheet style format. They generate summary data in a grid where the rows and columns represent groups of data. This provides the user with a report format that is easy to read and uses a small footprint on the page. After this chapter you should have a good understanding of how to use cross-tab reports and you'll also get some practice with creating them.
 Become a Crystal Reports expert with the authoritative resource available.
The tuturials and tips in this book will take your skills to the next level.
Become a Crystal Reports expert with the authoritative resource available.
The tuturials and tips in this book will take your skills to the next level.Buy at

This is an excerpt from the book Crystal Reports Encyclopedia.
Click to read more chapter excerpts.
Creating a Cross-Tab Object
The name "Cross-Tab Report" is a little misleading. It makes it sound like the whole report only shows the cross-tab grid and that no other data is printed. This isn't true. A cross-tab report refers to a report that has a cross-tab object in one of its sections. The rest of the report is just a typical report. This object is similar to the other report objects on a report. It has properties that let you modify its fields and how it's formatted.There are two ways to add a cross-tab object to your report. On an existing report, right-click on the report and select Insert | Cross-Tab. This changes the mouse to the shape of a rectangle. Drag and drop the rectangle onto the report where you want the cross-tab object to be shown. An empty cross-tab object, shown in Figure 10-4, is displayed as a placeholder.
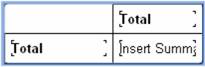
Figure 10-4. The Cross-Tab Expert placeholder.
The second way create a crosstab object is to choose the Cross-Tab Report Wizard from the Start Page. After selecting the data source and tables to pull data from, you are presented with the Cross-Tab Expert where you select the fields that are shown in the rows, columns, and summary fields. The Cross-Tab Expert is discussed next.
To read all my books online, click here for the Crystal Reports ebooks.