Chapter 10 - Creating Cross-Tab Reports
Cross-tab reports are a powerful way to create summaries of data in a spreadsheet style format. They generate summary data in a grid where the rows and columns represent groups of data. This provides the user with a report format that is easy to read and uses a small footprint on the page. After this chapter you should have a good understanding of how to use cross-tab reports and you'll also get some practice with creating them.
 Become a Crystal Reports expert with the authoritative resource available.
The tuturials and tips in this book will take your skills to the next level.
Become a Crystal Reports expert with the authoritative resource available.
The tuturials and tips in this book will take your skills to the next level.Buy at

This is an excerpt from the book Crystal Reports Encyclopedia.
Click to read more chapter excerpts.
Tutorial 10-1. Creating a Cross-Tab Report
Let's create a simple cross-tab report to see the basic steps. We'll create an annual sales report for customers.- The first task is to plan the cross-tab object by determining which fields belong in the rows and columns. The report summarizes data by customer and sales quarter. Since there a lot of products and fewer years, then we'll select the customer name as the row and the sales year as the column. Now let's build the report.
- Create a new report using the Cross-Tab Report Wizard.
- For the data source, choose the Xtreme.mdb database and select the tables Customer and Orders. Click the Next button.
- Check that two tables are linked by the Customer Id field. Click the Next button to confirm the table links.
- Find the field Customer.Customer Name in the Available Fields list and select it. Then drag it to the Rows list.
- Find the field Orders.Order Date in the Available Fields list and select it. Then drag it to the Columns list.
We don't want the cross-tab to display the individual date for each order. That would be too much information and wouldn't give us the benefit of begin able to summarize the sales data. So let's change the grouping function to group by year.
- Click on the Orders.Order Date field in the Columns list and click the drop-down box to view the available summary functions. Select the function For Each Year to summarize annually.
- For the summary field, click on the Orders.Order Amount field in the Available Fields list and drag it to the Summary Fields list. You can see that the default summary function is Sum, so we'll leave it like that.
- Click the Finish button to save your changes.
- Save the report as "Customer Annual Sales.rpt".
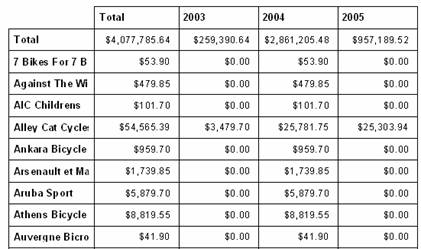
- Preview the report and it should look similar to Figure 10-gg.
Figure 10-gg. Annual sales listed by customer.
To read all my books online, click here for the Crystal Reports ebooks.