Chapter 10 - Creating Cross-Tab Reports
Cross-tab reports are a powerful way to create summaries of data in a spreadsheet style format. They generate summary data in a grid where the rows and columns represent groups of data. This provides the user with a report format that is easy to read and uses a small footprint on the page. After this chapter you should have a good understanding of how to use cross-tab reports and you'll also get some practice with creating them.
 Become a Crystal Reports expert with the authoritative resource available.
The tuturials and tips in this book will take your skills to the next level.
Become a Crystal Reports expert with the authoritative resource available.
The tuturials and tips in this book will take your skills to the next level.Buy at

Managing the Columns
One of the most interesting features of the cross-tab object is that it is dynamic. The number of columns changes according to the data being displayed. As an example, assume that you have a cross-tab report where the columns represent the historical sales figures per year. If a company has been in existence for five years, then there will be five columns printed. Once a new year starts, a new column is automatically added to the cross-tab. Columns are created on an as needed basis without requiring any additional work on your part.Dynamic columns are a blessing and a curse. The fact that you can even have dynamic columns is great. Being able to have the number of columns grow and shrink according to the data in a table is very powerful. You can't do this with standard reports objects. The drawback to this feature is that you can't control how many columns are created and you can't insert additional columns. You are at the mercy of the data.
Having columns dynamically added to your report is a problem when you get more columns than you expected. For example, assume that your company has twenty divisions world-wide and you formatted the cell's width so that there is just enough room on the page to represent each division. The report runs fine until six months later when your company acquires three new divisions. Now your columns run off the edge and onto a new page. The number of pages printed has just doubled and everyone is complaining to you about it. You have to watch out for this behavior and correct it if necessary.
Tip
When a cross-tab object spans multiple pages, the only data printed on the "virtual" pages is what is generated by the cross-tab report. The other report objects on the report do not get printed. If there is a header value that should be printed above the cross-tab, it will not appear after the first page. You can simulate a report header by adding an additional column field to the cross-tab object that only prints the header text.
To simulate a cross-tab header, follow these instructions. Create a formula that generates the header text. Open the Format Cross-Tab Expert and add the formula as the first field in the Columns window. Go to the Customize Style tab and experiment with the grid settings to make the report look just the way you want. You will probably have to turn on Suppress Row Grand Totals and turn certain grid lines off. An example is shown in Figure 11-11.
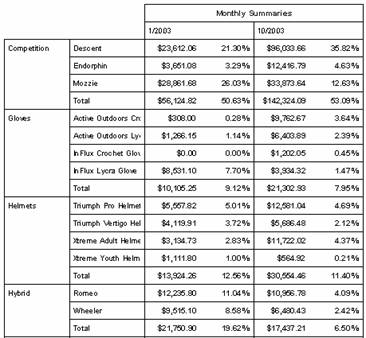
Figure 11-11. Adding a heading to the cross-tab object.
To read all my books online, click here for the Crystal Reports ebooks.