Chapter 10 - Creating Cross-Tab Reports
Cross-tab reports are a powerful way to create summaries of data in a spreadsheet style format. They generate summary data in a grid where the rows and columns represent groups of data. This provides the user with a report format that is easy to read and uses a small footprint on the page. After this chapter you should have a good understanding of how to use cross-tab reports and you'll also get some practice with creating them.
 Become a Crystal Reports expert with the authoritative resource available.
The tuturials and tips in this book will take your skills to the next level.
Become a Crystal Reports expert with the authoritative resource available.
The tuturials and tips in this book will take your skills to the next level.Buy at

This is an excerpt from the book Crystal Reports Encyclopedia.
Click to read more chapter excerpts.
To read all my books online, click here for the Crystal Reports ebooks.
Tutorial 10-3. Customizing the Cross-Tab Layout.
The summary fields within most cross-tab reports show all the data as looking the same. This has the benefit of consistently producing a professional looking report each time. But in a large cross-tab report it can sometimes be difficult to spot important information among the many pages of data. In this circumstance, it helps to customize the look of the individual fields within the cross-tab. By associating a summary field with a formula, important cross-tab data is emphasized so it is easy to find.One important point to be aware of when highlighting individual summary fields is that you can't modify them using the Cross-Tab Expert dialog box. This dialog box applies changes to the cross-tab report as a whole. It doesn't effect the data within the report. To do this, you have to move your cursor on top of the summary field and right-click. This opens the pop-up menu where you can select Format Field. See Figure 10-ab for an example.
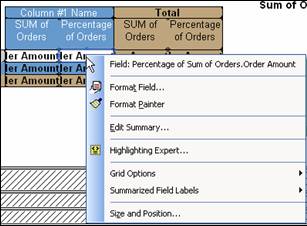
Figure 10-ab. Summary field pop-up menu.
In this tutorial we will change the formatting of data that falls outside of a valid range. We will modify the total order amount for each product by highlight products with less than $1,000 worth of sales. This will alert the manager that they either need to market the product better or discontinue it altogether.- Open the CrossTab.rpt sample report that was installed with Crystal Reports. Save it as CrossTab Highlight Sales.rpt.
- Make sure you are on the Design tab and right-click on the Sum Of Orders.Order Amount field.
- Select Format Field from the pop-up menu. This opens the Format Editor dialog box.
- Click on the Font tab and you'll see that the Style property is set to Bold. We want to change this to Regular so that only the fields that are under $1,000 are emphasized. Click on the drop-down box and change Bold to Regular.
Now we are going to create the formula which checks the summary field's value and if it is less than $1,000 then we add highlighting to it.
- For the Style property, click on the Formula Workshop button next to it to create a new formula. Enter the following formula:
If CurrentFieldValue < 1000 then
This formula compares the current fields' value to $1,000. If it is less, then the Style is set to bold. If not, then the Style is left as it's default attribute (regular).
crBold
Else
DefaultAttribute
- Click the Save and Close button to close the Formula Workshop. Then click the Ok button to close the Fomrat Editor dialog box.
The other summary field, Percentage of Others, has a default Style of Bold and we want to change it to Regular so that it matches the format of the order total summary field.- Right-click on the Percentage of Others summary field and select Format Field from the pop-up menu.
- Click on the Font tab and change the Style property to Regular.
- Click the Ok button to save your change.
- Preview the report to see what it looks like.
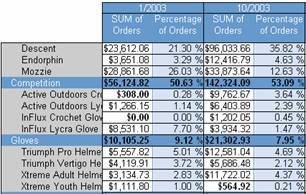
Figure 10-ac. Highlighting fields less than $1,000
The report shows three summary fields that are less than $1,000 and they are also bold. This lets the reader immediately notice which products should be reviewed for poor monthly sales.To read all my books online, click here for the Crystal Reports ebooks.