| Author |
Message |
SOSteppenwolf
Newbie


Joined: 12 Aug 2014
Online Status: Offline
Posts: 14
|
   Topic: SQL Rolling Date (Month) Columns in Pivot Table Topic: SQL Rolling Date (Month) Columns in Pivot Table
Posted: 17 Oct 2014 at 11:52am |
//Edited to (hopefully) simplify.
Here is what I currently have in my command.
select
"ItemTable"."ItemNum"
, [1] MM01
, [2] MM02
, [3] MM03
, ...
from (
select
"ItemTable"."ItemNum"
, DateDiff(m, "SalesTable"."SalesDate", GetDate()) months_ago
, "SalesTable"."SalesQty" - "SalesTable"."ReturnsQty" NetQty
from your_table
) as source
pivot
(
sum(NetQty) For months_ago in ([1], [2], [3], ...)
) as PivotTable
Here is a pic comparing what I have (with the above code) and what I want:
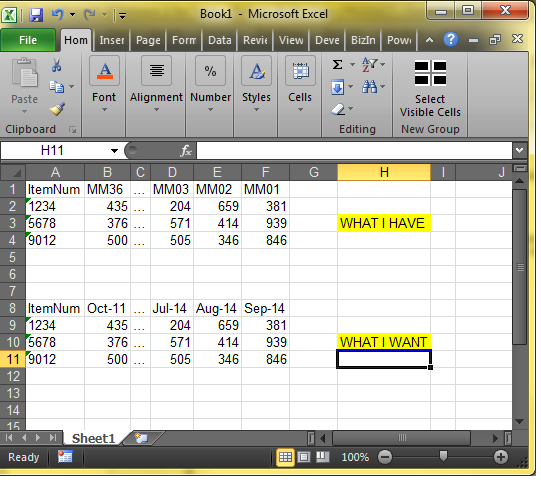
How do I change this to get what I want?
Edited by SOSteppenwolf - 21 Oct 2014 at 7:19am
|
|
I'm a accounting/finance guy by trade so please pardon the ignorance!
|
 IP Logged IP Logged |
|
|
DBlank
Moderator

Joined: 19 Dec 2008
Online Status: Offline
Posts: 9053
|
Posted: 20 Oct 2014 at 4:00am |
not exactly sure of what your trying to do here but you can limit the scope of what gets pivoted using a WHERE inside the query to make it roll from todays date
select
"ItemTable"."ItemNum"
, [1] MM01
, [2] MM02
, [3] MM03
, ...
from (
select
"ItemTable"."ItemNum"
, DateDiff(m, "SalesTable"."SalesDate", GetDate()) months_ago
, "SalesTable"."SalesQty" - "SalesTable"."ReturnsQty" NetQty
from your_table
WHERE DATEDIFF(MONTH, "SalesTable"."SalesDate", GetDate()) BETWEEN 1 and 36
) as source
pivot
(
sum(NetQty) For months_ago in ([1], [2], [3], ...)
) as PivotTable
|
|
IP Logged |
|
SOSteppenwolf
Newbie
Joined: 12 Aug 2014
Online Status: Offline
Posts: 14
|
Posted: 21 Oct 2014 at 7:18am |
|
Thanks for the WHERE tip. I edited my initial post for clarity. Please look at if you get the chance.
|
|
I'm a accounting/finance guy by trade so please pardon the ignorance!
|
|
IP Logged |
|
DBlank
Moderator
Joined: 19 Dec 2008
Online Status: Offline
Posts: 9053
|
Posted: 21 Oct 2014 at 7:56am |
DO you need to do this in your SQL or are you just looking for crystal column headers to be dynamic and 'roll' from todays date.
if crystal then just use a display as formul in the header as
totext(dateadd("m",-1,today),'MMM-yy')
You will have to change the subtracted value by 1 for each header
|
|
IP Logged |
|
SOSteppenwolf
Newbie
Joined: 12 Aug 2014
Online Status: Offline
Posts: 14
|
Posted: 21 Oct 2014 at 10:16am |
|
I am trying to do it all in SQL. I had initially tried to build it the "traditional" way but it quickly became too big due to the number of records and hundreds of formulas I was going to need.
|
|
I'm a accounting/finance guy by trade so please pardon the ignorance!
|
|
IP Logged |
|
DBlank
Moderator
Joined: 19 Dec 2008
Online Status: Offline
Posts: 9053
|
Posted: 21 Oct 2014 at 10:44am |
I may be missing somehting but I don't think you can do this and expect the report to function after this month.
If you dynamically change output column names Crystal would fail on on runs of the report in future months. It would not know what to do when it hits 'oct-2011' nor would it know what 'nov-2013' is. It also move the other months over one column.
By keeping the output headers as 1 through 36 you can dynamically change the dispaly labels in crystal without crashing the report.
If this is to export to excel you may consider bypassing crystal.
|
|
IP Logged |
|
SOSteppenwolf
Newbie
Joined: 12 Aug 2014
Online Status: Offline
Posts: 14
|
Posted: 23 Oct 2014 at 9:41am |
|
Actually I'm able to make the report rolling by using
DATEADD(m, -01, GETDATE()-day(GETDATE()-1)) AS "MM01"
for the header and
SUM (CASE WHEN "SalesTable"."SalesDate" BETWEEN DATEADD(m, -01, GETDATE()-day(GETDATE()-1)) AND DATEADD(m, -00, GETDATE()-day(GETDATE()-1))-1 THEN "SalesTable"."UnitSalesQty" - "SalesTable"."UnitReturnsQty" ELSE NULL END) AS "NetQty01
to pull the sales units. Only issue is that I have to take the above x36 plus all the other commands I'll need. That's why I wanted to go the pivot route.
Thanks for taking a stab at it anyhow.
Edited by SOSteppenwolf - 23 Oct 2014 at 9:42am
|
|
I'm a accounting/finance guy by trade so please pardon the ignorance!
|
|
IP Logged |
|
DBlank
Moderator
Joined: 19 Dec 2008
Online Status: Offline
Posts: 9053
|
Posted: 23 Oct 2014 at 9:55am |
I guess I am confused at your overall process.
If you don't need the row level details I would use the pvt sql to create the 36 columns using a sum function in the sql making all of the CAse statment you are doing moot.
the pvt, if done correctly will convert a row based sum result of the "month-year" into a columnular output. This can just place the fields in crystal on one detail section and make the header column use a display as formula as i indicated earlier. paint that formula to each header. you can then edit each one to alter the numeric value to get the right month-year display for that header. This makes the headers 'roll' with the data columns.
If you need the details (or don't mind pulling them in) just use a regular crystal crosstab (e.g. CT) (in the report header or footer) set to sum at the month. make your select statement roll off 36 months.
the headers in the CT will automaticlaly be the 'right month' .
You can alter the display type to make it the MMM-yy type you desire. YOu do that once for the header and it applies to allof the reslt columns.
This is much easier than your SUM with a case statement in it and rolls naturally based on the data pulled in via the select statement.
Edited by DBlank - 23 Oct 2014 at 9:59am
|
|
IP Logged |
|
SOSteppenwolf
Newbie
Joined: 12 Aug 2014
Online Status: Offline
Posts: 14
|
Posted: 27 Oct 2014 at 11:56am |
|
The CT is a novel approach I hadn't thought of. The report is going to require a lot more formulas, though and I'm not sure a CT is conducive to that. I've finally been able to put together a dynamic pivot table too. So, now I've got a few options to work with and have kind of got out of my stalemate.
Thanks,
|
|
I'm a accounting/finance guy by trade so please pardon the ignorance!
|
|
IP Logged |
|
lockwelle
Moderator
Joined: 21 Dec 2007
Online Status: Offline
Posts: 4372
|
Posted: 29 Oct 2014 at 8:28am |
|
Kind of coming late on this...couldn't you create a temp table, load it up with the various values for different months. I think that you could use a simple while loop so that there is very little code.
Then just join to that table to do the pivot. Include the month/year in the output and then use that populate the column headers in CR.
There will be the 36 formulas to display the headers correctly, but they should be cut and paste...maybe even a function. I don't know what other formulas might be needed.
It's my 2 cents
|
|
IP Logged |
|
|
|


