Hello Everybody,
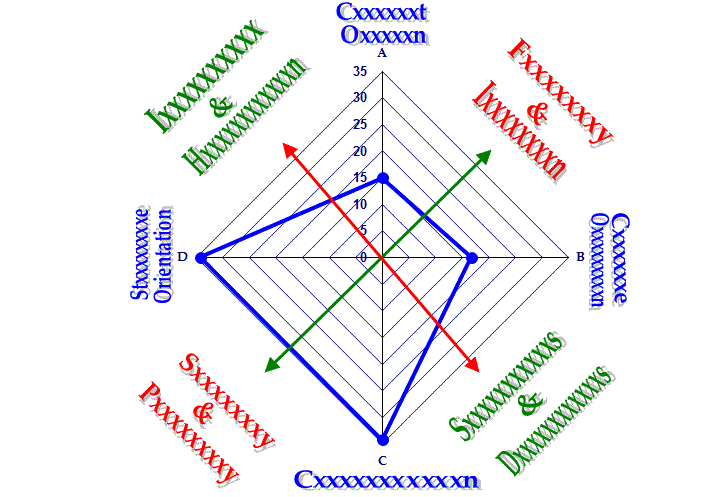
I tried to create a Radar
chart that I could create in excel and that looks as on a picture below that
would be ideal if I could do in VS2008:
 I put a Radar chart into a group area in VS2008:
It looks as on the picture below in a browser:
The appearance is far from
the excel chart:
1.
The
lines drawn are hidden behind the chart and there is no way I could find to
make them visible as Transparent is just not working for the chart.
2.
Another
problem the Details area (I suppressed it for now) shows all details that are
coming from stored procedure without grouping it.
Could anybody suggest what
could be done to make the drawn lines visible on a Radar chart, getting a
better appearance, and how to group details?
Thanks